


[Administrative note: This month's Pandas office hours will take place on Sunday, September 29th, at 7:15 p.m. in Israel. I'll send full info, including a link to the Zoom session, tomorrow. Come and ask any Pandas-related questions you have!]
Elections are about choosing a country's leaders, and in that sense, US elections – including those happening in November – are just like many others. But elections in the US also involve a great deal of money, with funds raised by candidates, parties, and political action committees (PACs). These actors report their fund-raising to the Federal Elections Commission (FEC, https://en.wikipedia.org/wiki/Federal_Election_Commission or https://fec.gov) which then reports this information to the public. The theory, at least, is that making fund-raising information public will make it harder for wealthy individuals and groups to affect elections. (In practice? I'm far from convinced.)
This week, we're looking at fund-raising information from political parties and PACs, reading the data into Pandas and then querying it. Except that this week's challenge didn't involve us querying the data. Rather, I asked you to build a dashboard with Streamlit (https://streamlit.io/) that enabled end users to query the data.
Streamlit is an open-source project, purchased several years ago by data company Snowflake (https://www.snowflake.com/en/). Using Streamlit, you don't have to write HTML, JavaScript, or CSS; you write Python code, using their methods, and then deploy the application to a server of your choice – including Streamlit's own cloud service.
Data and six questions
This week, I asked you to create a Streamlit app based on the public data released from the FEC via its "bulk data download page":
https://www.fec.gov/data/browse-data/?tab=bulk-data
On that page, scroll down to "PAC summary," and click on the + sign to its right. That'll open up a number of links, each for a different two-year election season. Click on the link for 2023-2024, or use this link:
https://www.fec.gov/files/bulk-downloads/2024/webk24.zip
That should download a zipfile for PAC data. When it is unzipped, it'll contain a single text file, webk24.txt, with the PAC data.
A data dictionary, and a list of the column names and descriptions, is at
https://www.fec.gov/campaign-finance-data/pac-and-party-summary-file-description/
Here are my six tasks and questions. I normally provide you with the Jupyter notebook that I used to solve problems; this week, I'll provide you with a zipfile containing not only my notebook, but also the Streamlit apps that I created to solve problems 2-5:
From the data in webk24.txt, as well as the data dictionary for this data, create a data frame. The index should be the committee ID (CMTE_ID), and the column names should be taken from the data dictionary.
For starters, I loaded up Pandas:
import pandas as pd
Then I wanted to load up the zipfile that I had downloaded, webk24.zip. I could have used unzip to open the file, and then work with the compressed file inside of it, webk24.txt. But if you had read_csv a file with a .zip extension, Pandas is smart enough to unzip it and then read it into a data frame. That's what I thus decided to do:
df = pd.read_csv(filename)
However, this didn't work: I got a ParserError exception, telling me that the parser expected to have 2 fields, but saw 3. At first glance, this might indicate that the file is damaged in some way. But upon opening (yes, unzipping) it and looking at the file, I saw that it was a CSV file in the sense of "character separated values," but definitely not the default of "comma separated values." The separator character here was the vertical bar (|), which we can indicate to read_csv by passing the sep keyword argument:
df = pd.read_csv(filename,
                 sep='|'
                )
The good news? This works, giving us a data frame. However, the file lacks a header line, which means that the first set row of data is being treated as the header names. We'll fix this by adding two keyword arguments: First, we'll say that there are no header names (by specifying header=None). Second, we'll pass a list of strings to the names keyword argument, giving the columns names.
Where will I get those names from? The data dictionary at https://www.fec.gov/campaign-finance-data/pac-and-party-summary-file-description/. It was a bit annoying for me to copy, paste, and edit those names into a list of strings, but I managed to do it. I then got the following:
df = pd.read_csv(filename,
                 sep='|',
                header=None,
                names= ['CMTE_ID', 'CMTE_NM', 'CMTE_TP',
                        'CMTE_DSGN', 'CMTE_FILING_FREQ',
                        'TTL_RECEIPTS', 'TRANS_FROM_AFF',
                        'INDV_CONTRIB', 'OTHER_POL_CMTE_CONTRIB',
                        'CAND_CONTRIB', 'CAND_LOANS', 'TTL_LOANS_RECEIVED',
                        'TTL_DISB', 'TRANF_TO_AFF', 'INDV_REFUNDS',
                        'OTHER_POL_CMTE_REFUNDS', 'CAND_LOAN_REPAY',
                        'LOAN_REPAY', 'COH_BOP', 'COH_COP',
                        'DEBTS_OWED_BY', 'NONFED_TRANS_RECEIVED',
                        'CONTRIB_TO_OTHER_CMTE', 'IND_EXP',
                        'PTY_COORD_EXP', 'NONFED_SHARE_EXP', 'CVG_END_DT'])
This actually worked just fine, almost giving us the data frame that I requested. The only thing that's missing at this point is the data frame's index, which I asked would be from the committee ID – the first column in the data frame, aka column CMTE_ID. I passed the index_col keyword argument, using the name that we provided in the names keyword argument:
df = pd.read_csv(filename,
                 sep='|',
                header=None,
                names= ['CMTE_ID', 'CMTE_NM', 'CMTE_TP',
                        'CMTE_DSGN', 'CMTE_FILING_FREQ',
                        'TTL_RECEIPTS', 'TRANS_FROM_AFF',
                        'INDV_CONTRIB', 'OTHER_POL_CMTE_CONTRIB',
                        'CAND_CONTRIB', 'CAND_LOANS', 'TTL_LOANS_RECEIVED',
                        'TTL_DISB', 'TRANF_TO_AFF', 'INDV_REFUNDS',
                        'OTHER_POL_CMTE_REFUNDS', 'CAND_LOAN_REPAY',
                        'LOAN_REPAY', 'COH_BOP', 'COH_COP',
                        'DEBTS_OWED_BY', 'NONFED_TRANS_RECEIVED',
                        'CONTRIB_TO_OTHER_CMTE', 'IND_EXP',
                        'PTY_COORD_EXP', 'NONFED_SHARE_EXP', 'CVG_END_DT'],
                index_col='CMTE_ID')
This resulted in a data frame with 11,916 rows and 26 columns. Success!
Create a Streamlit app that displays this data frame, in its entirety. Have a title (e.g., "PAC fund-raising explorer") at the top of the page.
Next, I asked you to create a Streamlit application that displays the entire data frame. You write a Streamlit app as a Python program, with a .py extension. (You have to install Streamlit first, with pip install streamlit on the command line.)
What's remarkable about Streamlit, at least for someone like me who has been doing Web development since 1993, is the lack of HTML, JavaScript, CSS, or anything else on the front end. You write your program using Python, Pandas, and Streamlist objects; when the app runs, the appropriate back-end and front-end code is run, resulting in a Web app.
The first thing that any Streamlit app needs to do is load the streamlit module. The first two lines of my app are thus going to be:
import streamlit as st
import pandas as pd
Next, I included the code that we reviewed in question 1, loading the data from the FEC's CSV file into a data frame:
filename = '/Users/reuven/Downloads/webk24.txt'
df = pd.read_csv(filename, sep='|',
                 header=None,
                 names= ['CMTE_ID',
                         'CMTE_NM', 'CMTE_TP', 'CMTE_DSGN',
                         'CMTE_FILING_FREQ', 'TTL_RECEIPTS', 'TRANS_FROM_AFF',
                         'INDV_CONTRIB', 'OTHER_POL_CMTE_CONTRIB',
                         'CAND_CONTRIB', 'CAND_LOANS', 'TTL_LOANS_RECEIVED',
                         'TTL_DISB', 'TRANF_TO_AFF', 'INDV_REFUNDS',
                         'OTHER_POL_CMTE_REFUNDS', 'CAND_LOAN_REPAY',
                         'LOAN_REPAY', 'COH_BOP', 'COH_COP', 'DEBTS_OWED_BY',
                         'NONFED_TRANS_RECEIVED', 'CONTRIB_TO_OTHER_CMTE',
                         'IND_EXP', 'PTY_COORD_EXP', 'NONFED_SHARE_EXP',
                         'CVG_END_DT'],
                 index_col='CMTE_ID')
Finally, I invoked two Streamlit methods. The first, st.title, displays a title at the top of the Web page. The second, st.dataframe, takes a Pandas data frame as an argument, and displays it on the screen.
The entirety of my app now looks like this:
import streamlit as st
import pandas as pd

filename = '/Users/reuven/Downloads/webk24.txt'
df = pd.read_csv(filename, sep='|',
                 header=None,
                 names= ['CMTE_ID',
                         'CMTE_NM', 'CMTE_TP', 'CMTE_DSGN',
                         'CMTE_FILING_FREQ', 'TTL_RECEIPTS', 'TRANS_FROM_AFF',
                         'INDV_CONTRIB', 'OTHER_POL_CMTE_CONTRIB',
                         'CAND_CONTRIB', 'CAND_LOANS', 'TTL_LOANS_RECEIVED',
                         'TTL_DISB', 'TRANF_TO_AFF', 'INDV_REFUNDS',
                         'OTHER_POL_CMTE_REFUNDS', 'CAND_LOAN_REPAY',
                         'LOAN_REPAY', 'COH_BOP', 'COH_COP', 'DEBTS_OWED_BY',
                         'NONFED_TRANS_RECEIVED', 'CONTRIB_TO_OTHER_CMTE',
                         'IND_EXP', 'PTY_COORD_EXP', 'NONFED_SHARE_EXP',
                         'CVG_END_DT'],
                 index_col='CMTE_ID')

st.title('PAC fund-raising explorer')
st.dataframe(df)
With this stored in the file bw85-q2.py, I then go to the command line and type:
streamlit run bw85-q2.pyThe first time you run a Streamlit app, it'll ask you to enter your e-mail address to get updates on the project. Following that, it will display a message telling you how to access your application. On my computer, it wrote:
  You can now view your Streamlit app in your browser.

  Local URL: http://localhost:8501
  Network URL: http://192.168.1.166:8501
I went to that URL, and saw the following in my browser:
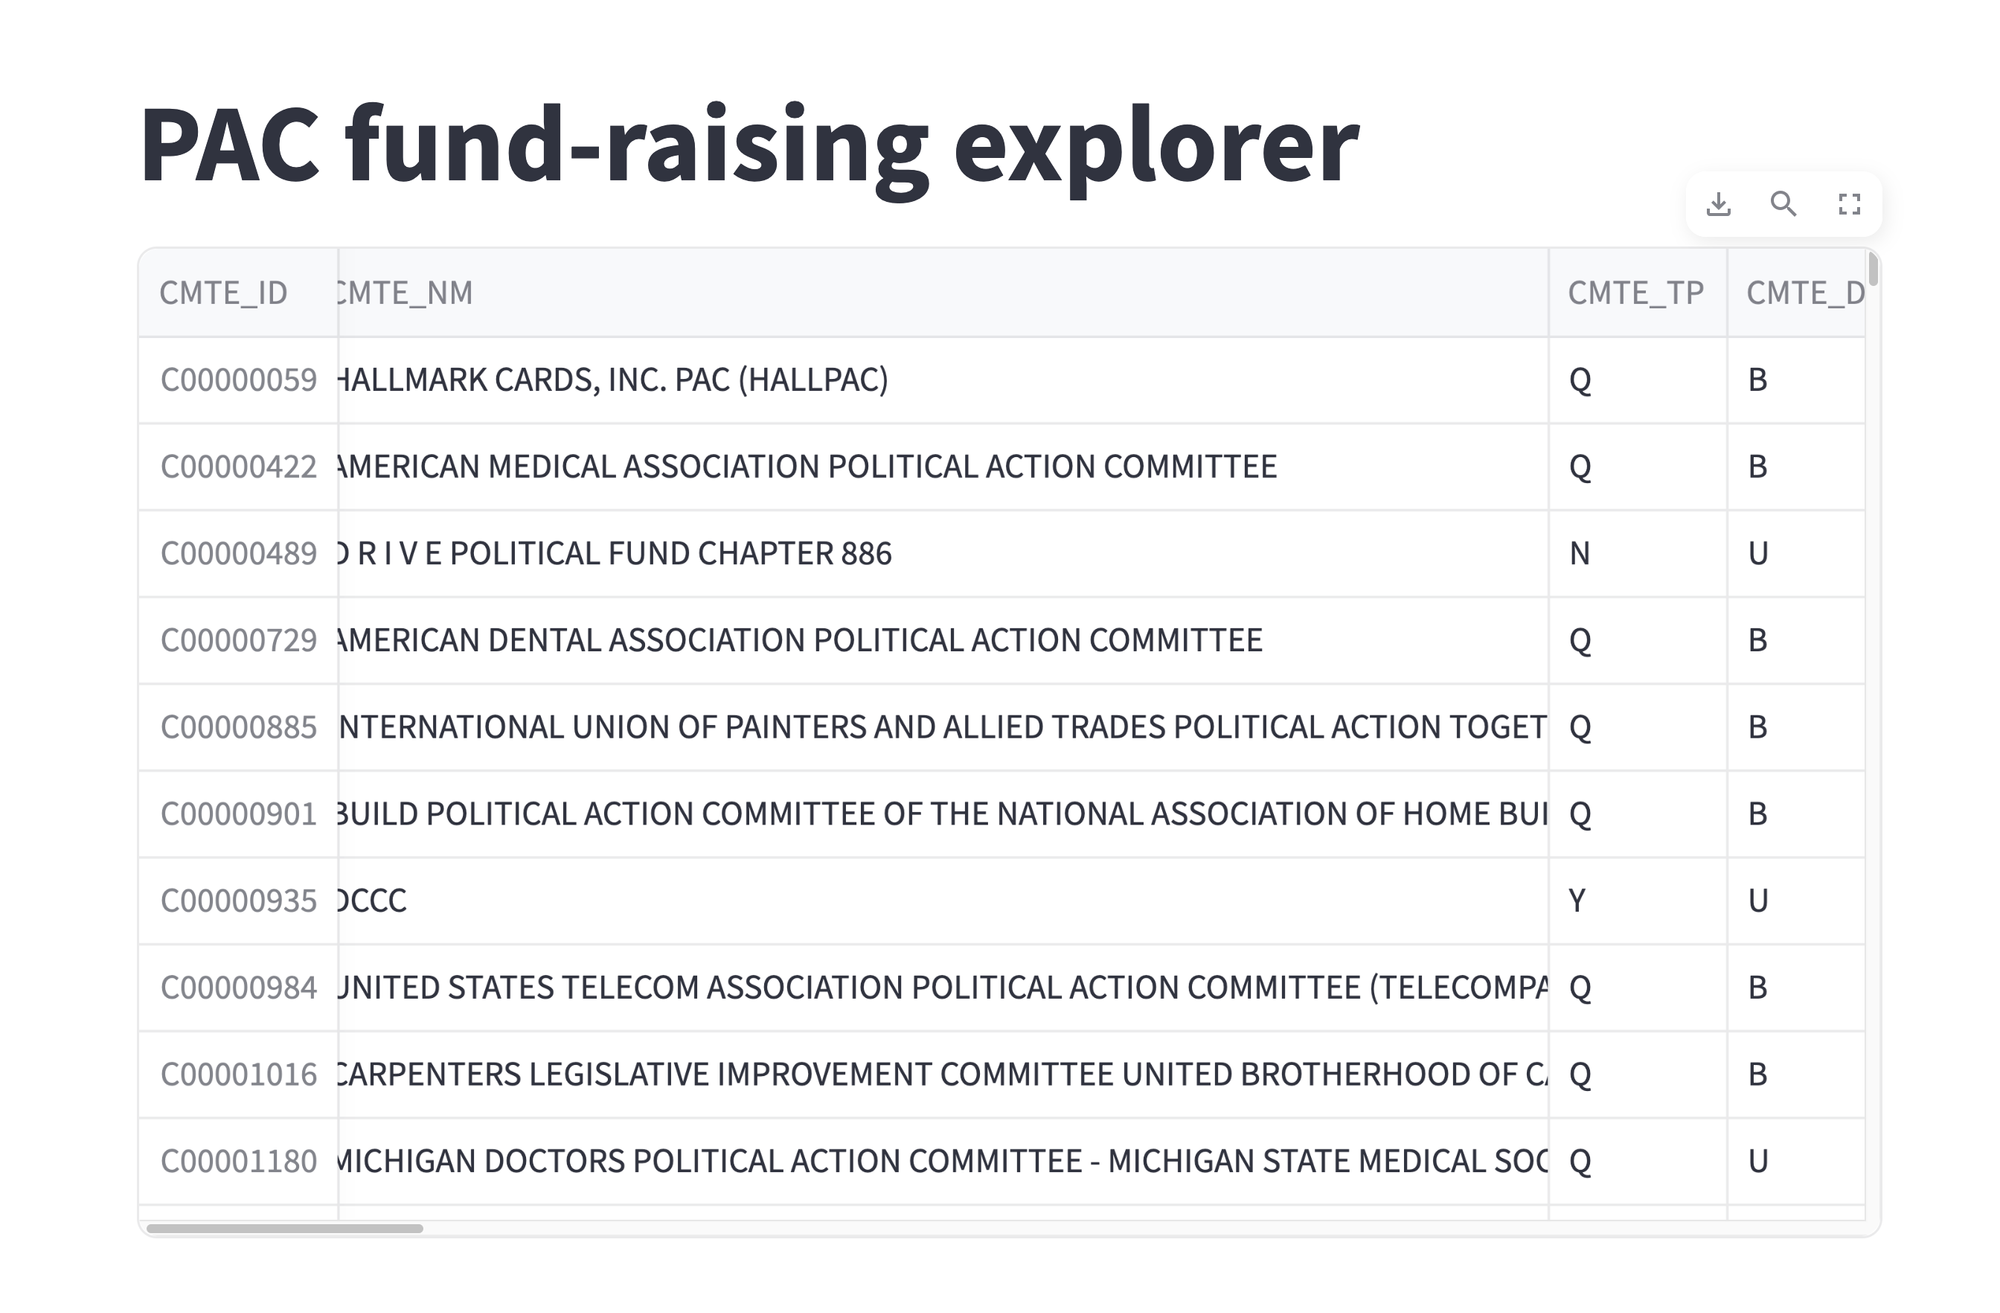
This shows our data frame, displayed in a browser. The three buttons at the top right of the data frame provide some interactive functionality:
- You can download the data frame as a CSV file
- You can search through the data frame for matching strings
- You can expand the data frame to fill the entire screen
Not bad, for adding a handful of lines of code to our application, right?