This week, we looked at the latest plant hardiness zone map distributed by the US Department of Agriculture (USDA), and how it differs from the previous map, which came out in 2012.
The map is meant to help gardeners, and people interested in gardening and plants, know which plants will survive and thrive in different parts of the United States. The main data point used by the map is the mean low temperature recorded (in Fahrenheit) for a given location. Locations with similar mean low temperatures, within a 10-degree range, are categorized as being in the same zone. Each zone is then further divided into two sub-zones, with a 5-degree range for minimum temperatures.
The latest zone map showed that for many locations, the minimum temperature had risen somewhat. This doesn’t come as a massive surprise, given trends in climate change, but I thought that it would be interesting to explore the data and understand just where things had changed.
The data was collected by the PRISM research group at Oregon State University (https://prism.oregonstate.edu/projects/plant_hardiness_zones.php). A new data set was just released on November 15th by the US Department of Agriculture, at https://www.ars.usda.gov/news-events/news/research-news/2023/usda-unveils-updated-plant-hardiness-zone-map/.
The data is available in a variety of formats, but I decided that it would probably be easiest to work with it via zip codes, because they are spread out through the entire country. In order to figure out just where the zip codes are located, we downloaded an additional data set, a map of zip codes along with location information for each one, joining it together with our other data.
Data and eight questions
This week's data comes in several parts:
First, we'll use the latest (2023) Plant Hardiness Zone report from https://prism.oregonstate.edu/projects/plant_hardiness_zones.php . The data comes in several formats and parts; we'll use the CSV file that provides us with data per US zip code:
https://prism.oregonstate.edu/projects/phm_data/phzm_us_zipcode_2023.csv
Next, we'll download data from the previous survey in 2012, described at https://prism.oregonstate.edu/projects/plant_hardiness_zones_2012.php :
https://prism.oregonstate.edu/projects/public/phm/2012/phm_us_zipcode_2012.csv
Finally, we'll download and work with a CSV file containing US zip codes:
http://uszipcodelist.com/zip_code_database.csv
Here are this week’s eight tasks and questions, along with my solutions. A link to the Jupyter notebook I used to solve these problems follows the final answer.
Create data frames from the 2012 and 2023 plant hardiness zone data. Each data frame should have a 5-character "zipcode" column, as well as a "zone" column with the zone's name and a "trange" column with the range it includes. Make the "zipcode" column the index.
To start off, let’s load Pandas:
import pandas as pd
from pandas import Series, DataFrame
I normally use these two lines whenever I work with Pandas. The first loads it up, along with the standard alias used throughout the Pandas world. The second makes it a bit more convenient to create a series or data frame.
Once we’ve done that, I want to create two different data frames, one from the 2012 data and another from the 2023 data. Fortunately, the CSV files are identical except for the URLs, so the moment we have the query correct for one, we’ll have it right for the other, as well.
I could download the CSV file onto my computer and then use “read_csv” in order to import it into a data frame. But if the file isn’t too big, and if the server doesn’t refuse my requests, I prefer to just pass the URL as an argument to read_csv:
df_2023 = pd.read_csv('https://prism.oregonstate.edu/projects/phm_data/phzm_us_zipcode_2023.csv')This works, but there are a few things that we want to change from the defaults:
First: We only need three of the columns: zone, trange, and zipcode. We can use the “usecols” keyword argument to specify those.
Next: We want the “zipcode” column to be our index. We can use the “index_col” keyword argument to specify that.
A more subtle problem is that the “zipcode” column contains only digits, so when Pandas reads that data in, it sets the dtype to be an integer type. However, it then removes leading zeroes from the zip codes. This means that zip code 02134 (of “send it to Zoom!” fame) would be stored as the integer 2314.
The solution is for us to set the dtype for this column by passing the “dtype” keyword argument to read_csv. The value for this keyword argument is a dict, whose keys are the columns we want to specify and whose values are the dtypes we want to use. In this particular case, we just want to set the “zipcode” column to be a string.
Our final query is thus:
df_2012 = pd.read_csv('https://prism.oregonstate.edu/projects/public/phm/2012/phm_us_zipcode_2012.csv',
                      usecols=['zone', 'trange', 'zipcode'],
                      dtype={'zipcode':str},
                      index_col='zipcode')
We can repeat the same query for 2023, using the URL for the 2023 data:
df_2023 = pd.read_csv('https://prism.oregonstate.edu/projects/phm_data/phzm_us_zipcode_2023.csv',
                      usecols=['zone', 'trange', 'zipcode'],
                     dtype={'zipcode':str},
                     index_col='zipcode')
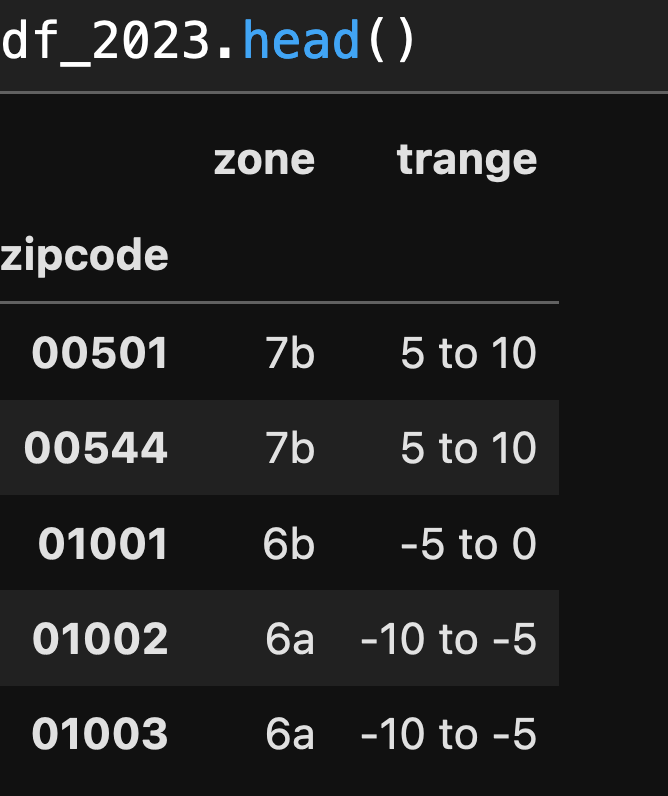
Here’s what the start of the 2023 data frame looks like:

Create a data frame from the zip code database, in which the 5-character "zip" column is the index.
Next, I asked you to create a separate data frame from the zip code database that I found online. Once again, I passed a URL to read_csv, and used the “dtype” and “index_col” keyword arguments to ensure that zip codes are treated as five-character strings, and that the “zip” column is set to be our data frame’s index:
zip_code_csv = pd.read_csv('http://uszipcodelist.com/zip_code_database.csv',
                          dtype={'zip':str},
                          index_col='zip')
I should note that specifying the dtypes of columns in the data frame you’re creating from a CSV file can speed up the loading and creation of the data frame. That’s because Pandas doesn’t need to analyze and guess the type, but will just go along with whatever you’ve said it should do.
Now that we have our three data frames set up, let’s start to analyze the data!

