


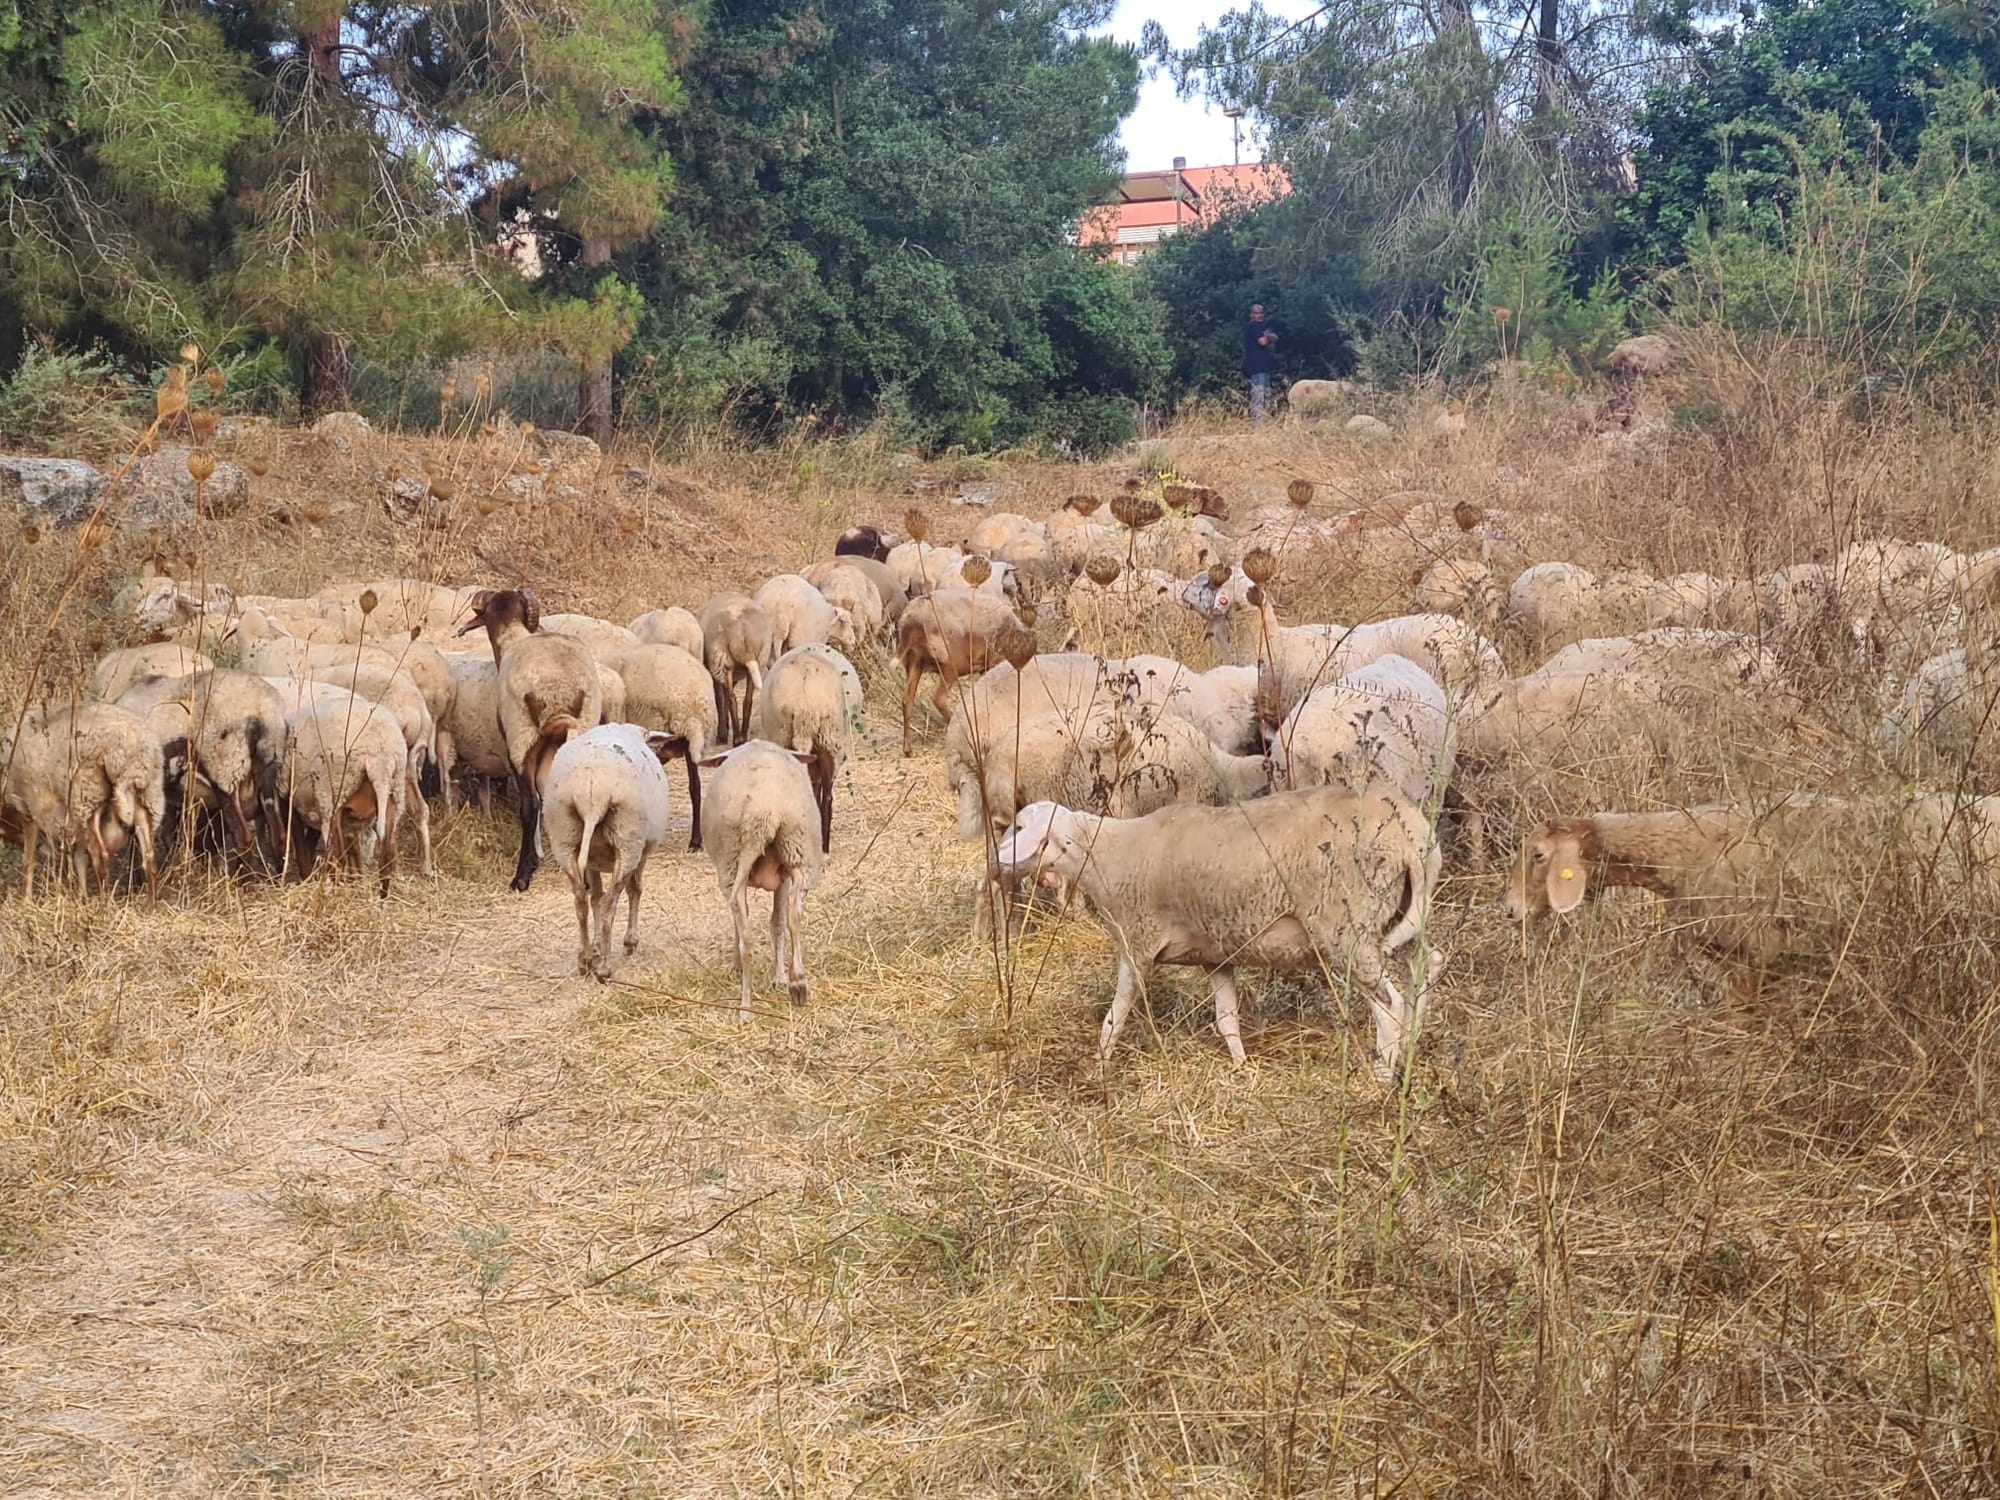
I love to walk. I try to take a long walk at dawn each day, enjoying several of my city's parks as the sun rises. During the summer months, the city has flocks of sheep come to eat the wild brush, reducing the chances of forest fires. Here are the sheep I just saw yesterday:
When I travel, I enjoy walking around both as a way to explore a new place, and also to cement its geography in my head. I'll be in Prague for Euro Python next month, and you might laugh, but I'm looking forward to walking about an hour from my hotel to the convention center.
Of course, some cities are more amenable to walking than others. (When I was in San Jose, California, I was almost certainly the only person walking to work.) Sometimes, you need to go farther than you can or will walk. In some cities, people will use their bicycles. But if you won't walk or cycle, then are you more likely to drive or take public transportation? If we restrict the question to how people get to work, then we can probably get clearer results, and perhaps even learn something about how different cities operate.
A recent article in the Economist (https://www.economist.com/interactive/2024-walkable-cities) summarized a recent paper in the journal Science by researchers Rafael Prieto-Curiel and Juan P. Ospina. Their paper, "The ABC of mobility" (https://www.sciencedirect.com/science/article/pii/S0160412024001272), looks at the "modal share" for three different types of transportation in a city – active (walking/biking), public transportation, and driving. The researchers collected many studies about transportation and work, from a wide variety of cities, in order to understand each city. They then looked at other factors to consider for a given city, such as income, population, and location in the world.
I should add that the "ABC" in the title refers to the three types of mobility that the researchers discuss:
Astands for "active," and includes walking and bikingBstands for "bus," and is the overall category for public transportationCstands for "car," and describes people who drive to work
They found, not surprisingly, that cities in North America rely on cars more than in the rest of the world.
Even in New York, a city in which people famously walk and use public transportation quite a lot, many people still commute by car. A proposal to charge drivers extra if they go to the most-congested parts of Manhattan during peak hours was about to go into effect on June 30th, but New York Governor Kathy Hochul suspended the plan earlier this month (https://www.nytimes.com/2024/06/05/nyregion/congestion-pricing-pause-hochul.html?unlocked_article_code=1.2k0.xMmn.a7Q2Lxo3J885&smid=url-share), reducing the incentive to use public transportation while simultaneously adding a $1 billion hole to the public transportation budget.
Data and seven questions
The researchers behind the ABC paper have a Web site (https://citiesmoving.com/) with interactive visualizations. And, fortunately for us, they have also made their data available at
https://github.com/rafaelprietocuriel/ModalShare/blob/main/ModalShare.csv
We'll be exploring that data this week in a variety of tasks. The learning goals include multi-indexes, grouping, pivot tables, and plotting among others.
Here are my seven tasks and questions for you:
- Import the CSV file into a data frame. We'll want a three-part multi-index from the
region,Country, andCitycolumns. - How many distinct cities were represented in this research? Which 10 cities were surveyed the most times?